Increasing HubSpot Sales Activation to 60%
Company
HubSpot
Work Done
Experiment design, UI design
Timeframe
2 months
Stakeholders
Product manager, Product analyst, Technical lead

Background
HubSpot is a platform for sales, marketing, and customer success. HubSpot Sales is a free Google Chrome and Microsoft Outlook extension that provides email tracking and CRM tools for salespeople. Although this was a free extension, it contributed to signups and upgrades to the paid HubSpot Sales product. At the time, we found that users who tracked an email with the extension were 20% more likely to try another HubSpot Sales tool and adopt the paid product. Therefore, the goal of this project was to increase activation of those free users by 10%.
Users
The project focused on new users who signed up for HubSpot from the free HubSpot Sales extension. Our biggest persona was the sales representative. A common upgrade path was a sales rep installing the extension > getting their team members to use it > and then getting their company to upgrade to access more features.
Defining Activation
At the start of this project, I worked with my product manager and data analyst to define activation for this product. We defined activation as events that suggest a user is successfully exploring and learning about our product. To uncover these events, we leaned into two types of data:
Quantitatively, we looked at usage data of new users in their first 30 days to figure out if there were common actions that they took or actions that made them more likely to be a weekly active user (This was a metric HubSpot used to measure how engaged a user was overall in both the free and paid sales product).
Qualitatively, we leaned on Chrome Store reviews, Microsoft AppSource reviews, and anecdotal insights from past interviews to figure out why users installed the extension and what tools stood out to them.
Two key events contributed to the success of new users:
Connecting their inbox to HubSpot: This was an optional task during the extension setup that gave HubSpot elevated permissions in the users’ email inbox. We found that users who completed this step were more likely to be active users because it gave them access to more tools. We also found that our happiest reviews came from users who called out the tools this task unlocked.
Sending a tracked email: Looking at user reviews and past customer interviews, we saw users would often mention email tracking as a key feature of the product even though the product offered a suite of tools. Usage data validated as we saw that users who sent a tracked email were 20% more likely to try another product in the HubSpot Sales suite.
For our activation metric, we look specifically at
# of users who send a tracked email within the first 7 days of installing the extension.
We took the other event (connecting inbox) as a key metric in a different project where we sought to improve the setup process for the extension.
Onboarding Tour Experiment
When I joined this project, the extension already had an extensive 11-step onboarding tour that walked users through how to use the CRM, tracking emails, creating new contacts, and exploring their extension settings. My product manager and I hypothesized:
We believe that if we give sales reps a shorter onboarding experience focused on sending a tracked email, we can raise activation by 10%.
Experiment Design
Duration: 30 Days
Users: New users from the Chrome extension. Although the extension also exist for Microsoft Outlook, we focused on Chrome for the experiment because the Chrome extension received more daily signups (~100 signups/day). Furthermore, the Chrome Store development and approval process was faster than Microsoft Store. This enabled our engineers to quickly develop and track the experiment.
Distribution: 50% received the control, the 11-step tour. 50% received the 4-step experimental tour.
Metrics:
Activation: % of users who saw the tour and sent a tracked email within 7 days.
Completion % of users who started the tour and completed it to the end.
Control
The control was the onboarding tour already in production - An extensive 11-step tour covering multiple features of the extension including email tracking, creating contacts, and logging emails to the CRM.

Experimental variant
The experimental variant was a 4-step tour solely focused on how to track an email with the extension.

Results from experiment
The experimental variant had a 3.3% increase in activation compared to the control
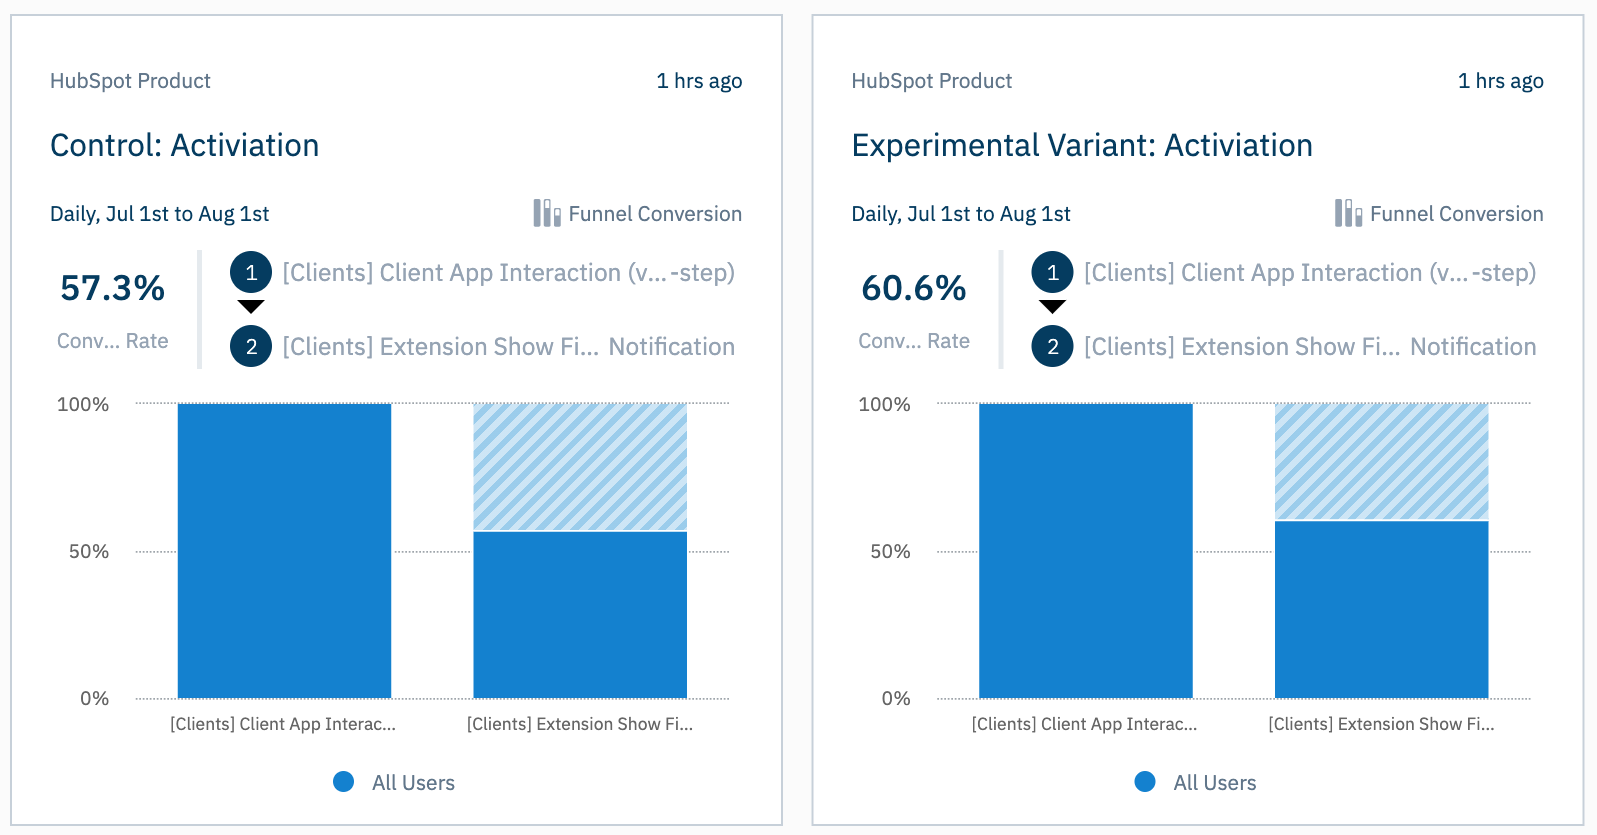
Control on the left; Experiment on the right
Although the 3.3% increase did prove statistical significant in preference for the experimental variant, we missed the 10% increase in activation we had set for ourselves at the beginning of the experiment.
We thought one reason there wasn’t a larger different between the two tours was because both tours covered email tracking at some point. While the experimental variant only covered email tracking, the control covered email tracking in one of its first steps. When we looked at the completion rate of the two tours (what % of users who started the tour completed it), we saw that the experimental variant had a 7.4% increase in completion. It’s possible that users in the control tour abandoned the tour after they learned about email tracking, which could explain why there was such a large different in completion between the two tours.

Based on the 3.3% increase in activation and 7.4% difference in completion, the experimental variant was deemed the winner of the experiment, and new users were shown this variant moving forward.
Learnings from this project
Define your metrics before you try moving them
Before this project, the team was only looking at the completion rate of the tour. This metric was rooted in the success of the tour, but it didn’t really tell us if users were more successful from completing it. By looking at usage data and qualitative insights, we were able to define an activation metric rooted in tasks our most active users completed in their first 7 days. Looking at both activation and tour completion, we saw a clearer picture of how successful our users were and how effective the tour was in making them successful.
Just because you didn’t reach your goal, it doesn’t mean the experiment is a failure:
While we didn’t raise activation by 10% in the experiment, we still were able to raise activation by giving users a shorter, more targeted onboarding. A technical win we also got from the experiment was a redesigned onboarding tour component that allowed our engineers to quickly iterate on the experiment. I moved to another product after this project, but I would’ve loved to keep iterating on the tour. For example, another experiment I had planned was asking users in the beginning of the tour what they wanted to learn about and catering the tour based on their answer.